You are viewing documentation for Kubernetes version: v1.23
Kubernetes v1.23 documentation is no longer actively maintained. The version you are currently viewing is a static snapshot. For up-to-date documentation, see the latest version.
My exciting journey into Kubernetes’ history
Author: Sascha Grunert, SUSE Software Solutions
Editor's note: Sascha is part of SIG Release and is working on many other different container runtime related topics. Feel free to reach him out on Twitter @saschagrunert.
A story of data science-ing 90,000 GitHub issues and pull requests by using Kubeflow, TensorFlow, Prow and a fully automated CI/CD pipeline.
- Introduction
- Getting the Data
- Exploring the Data
- Building the Machine Learning Model
- Automate Everything
- Automatic Labeling of new PRs
- Summary
Introduction
Choosing the right steps when working in the field of data science is truly no silver bullet. Most data scientists might have their custom workflow, which could be more or less automated, depending on their area of work. Using Kubernetes can be a tremendous enhancement when trying to automate workflows on a large scale. In this blog post, I would like to take you on my journey of doing data science while integrating the overall workflow into Kubernetes.
The target of the research I did in the past few months was to find any useful information about all those thousands of GitHub issues and pull requests (PRs) we have in the Kubernetes repository. What I ended up with was a fully automated, in Kubernetes running Continuous Integration (CI) and Deployment (CD) data science workflow powered by Kubeflow and Prow. You may not know both of them, but we get to the point where I explain what they’re doing in detail. The source code of my work can be found in the kubernetes-analysis GitHub repository, which contains everything source code-related as well as the raw data. But how to retrieve this data I’m talking about? Well, this is where the story begins.
Getting the Data
The foundation for my experiments is the raw GitHub API data in plain JSON
format. The necessary data can be retrieved via the GitHub issues
endpoint, which returns all pull requests as well as regular issues in the
REST API. I exported roughly 91000 issues and pull requests in
the first iteration into a massive 650 MiB data blob. This took me about 8
hours of data retrieval time because for sure, the GitHub API is rate
limited. To be able to put this data into a GitHub repository, I’d chosen
to compress it via xz(1). The result was a roundabout 25 MiB sized
tarball, which fits well into the repository.
I had to find a way to regularly update the dataset because the Kubernetes issues and pull requests are updated by the users over time as well as new ones are created. To achieve the continuous update without having to wait 8 hours over and over again, I now fetch the delta GitHub API data between the last update and the current time. This way, a Continuous Integration job can update the data on a regular basis, whereas I can continue my research with the latest available set of data.
From a tooling perspective, I’ve written an all-in-one Python executable, which allows us to trigger the different steps during the data science experiments separately via dedicated subcommands. For example, to run an export of the whole data set, we can call:
> export GITHUB_TOKEN=<MY-SECRET-TOKEN>
> ./main export
INFO | Getting GITHUB_TOKEN from environment variable
INFO | Dumping all issues
INFO | Pulling 90929 items
INFO | 1: Unit test coverage in Kubelet is lousy. (~30%)
INFO | 2: Better error messages if go isn't installed, or if gcloud is old.
INFO | 3: Need real cluster integration tests
INFO | 4: kubelet should know which containers it is managing
… [just wait 8 hours] …
To update the data between the last time stamp stored in the repository we can run:
> ./main export --update-api
INFO | Getting GITHUB_TOKEN from environment variable
INFO | Retrieving issues and PRs
INFO | Updating API
INFO | Got update timestamp: 2020-05-09T10:57:40.854151
INFO | 90786: Automated cherry pick of #90749: fix: azure disk dangling attach issue
INFO | 90674: Switch core master base images from debian to distroless
INFO | 90086: Handling error returned by request.Request.ParseForm()
INFO | 90544: configurable weight on the CPU and memory
INFO | 87746: Support compiling Kubelet w/o docker/docker
INFO | Using already extracted data from data/data.pickle
INFO | Loading pickle dataset
INFO | Parsed 34380 issues and 55832 pull requests (90212 items)
INFO | Updating data
INFO | Updating issue 90786 (updated at 2020-05-09T10:59:43Z)
INFO | Updating issue 90674 (updated at 2020-05-09T10:58:27Z)
INFO | Updating issue 90086 (updated at 2020-05-09T10:58:26Z)
INFO | Updating issue 90544 (updated at 2020-05-09T10:57:51Z)
INFO | Updating issue 87746 (updated at 2020-05-09T11:01:51Z)
INFO | Saving data
This gives us an idea of how fast the project is actually moving: On a Saturday at noon (European time), 5 issues and pull requests got updated within literally 5 minutes!
Funnily enough, Joe Beda, one of the founders of Kubernetes, created the first GitHub issue mentioning that the unit test coverage is too low. The issue has no further description than the title, and no enhanced labeling applied, like we know from more recent issues and pull requests. But now we have to explore the exported data more deeply to do something useful with it.
Exploring the Data
Before we can start creating machine learning models and train them, we have to get an idea about how our data is structured and what we want to achieve in general.
To get a better feeling about the amount of data, let’s look at how many issues and pull requests have been created over time inside the Kubernetes repository:
> ./main analyze --created
INFO | Using already extracted data from data/data.pickle
INFO | Loading pickle dataset
INFO | Parsed 34380 issues and 55832 pull requests (90212 items)
The Python matplotlib module should pop up a graph which looks like this:
Okay, this looks not that spectacular but gives us an impression on how the project has grown over the past 6 years. To get a better idea about the speed of development of the project, we can look at the created-vs-closed metric. This means on our timeline, we add one to the y-axis if an issue or pull request got created and subtracts one if closed. Now the chart looks like this:
> ./main analyze --created-vs-closed
At the beginning of 2018, the Kubernetes projects introduced some more enhanced life-cycle management via the glorious fejta-bot. This automatically closes issues and pull requests after they got stale over a longer period of time. This resulted in a massive closing of issues, which does not apply to pull requests in the same amount. For example, if we look at the created-vs-closed metric only for pull requests.
> ./main analyze --created-vs-closed --pull-requests
The overall impact is not that obvious. What we can see is that the increasing number of peaks in the PR chart indicates that the project is moving faster over time. Usually, a candlestick chart would be a better choice for showing this kind of volatility-related information. I’d also like to highlight that it looks like the development of the project slowed down a bit in the beginning of 2020.
Parsing raw JSON in every analysis iteration is not the fastest approach to do in Python. This means that I decided to parse the more important information, for example the content, title and creation time into dedicated issue and PR classes. This data will be pickle serialized into the repository as well, which allows an overall faster startup independently of the JSON blob.
A pull request is more or less the same as an issue in my analysis, except that it contains a release note.
Release notes in Kubernetes are written in the PRs description into a separate
release-note block like this:
```release-note
I changed something extremely important and you should note that.
```
Those release notes are parsed by dedicated Release Engineering Tools like
krel during the release creation process and will be part of the various
CHANGELOG.md files and the Release Notes Website. That seems like a
lot of magic, but in the end, the quality of the overall release notes is much
higher because they’re easy to edit, and the PR reviewers can ensure that we
only document real user-facing changes and nothing else.
The quality of the input data is a key aspect when doing data science. I decided to focus on the release notes because they seem to have the highest amount of overall quality when comparing them to the plain descriptions in issues and PRs. Besides that, they’re easy to parse, and we would not need to strip away the various issue and PR template text noise.
Labels, Labels, Labels
Issues and pull requests in Kubernetes get different labels applied during its
life-cycle. They are usually grouped via a single slash (/). For example, we
have kind/bug and kind/api-change or sig/node and sig/network. An easy
way to understand which label groups exist and how they’re distributed across
the repository is to plot them into a bar chart:
> ./main analyze --labels-by-group
It looks like that sig/, kind/ and area/ labels are pretty common.
Something like size/ can be ignored for now because these labels are
automatically applied based on the amount of the code changes for a pull
request. We said that we want to focus on release notes as input data, which
means that we have to check out the distribution of the labels for the PRs. This
means that the top 25 labels on pull requests are:
> ./main analyze --labels-by-name --pull-requests
Again, we can ignore labels like lgtm (looks good to me), because every PR
which now should get merged has to look good. Pull requests containing release
notes automatically get the release-note label applied, which enables further
filtering more easily. This does not mean that every PR containing that label
also contains the release notes block. The label could have been applied
manually and the parsing of the release notes block did not exist since the
beginning of the project. This means we will probably loose a decent amount of
input data on one hand. On the other hand we can focus on the highest possible
data quality, because applying labels the right way needs some enhanced maturity
of the project and its contributors.
From a label group perspective I have chosen to focus on the kind/ labels.
Those labels are something which has to be applied manually by the author of the
PR, they are available on a good amount of pull requests and they’re related to
user-facing changes as well. Besides that, the kind/ choice has to be done for
every pull request because it is part of the PR template.
Alright, how does the distribution of those labels look like when focusing only on pull requests which have release notes?
> ./main analyze --release-notes-stats
Interestingly, we have approximately 7,000 overall pull requests containing
release notes, but only ~5,000 have a kind/ label applied. The distribution of
the labels is not equal, and one-third of them are labeled as kind/bug. This
brings me to the next decision in my data science journey: I will build a binary
classifier which, for the sake of simplicity, is only able to distinguish between
bugs (via kind/bug) and non-bugs (where the label is not applied).
The main target is now to be able to classify newly incoming release notes if they are related to a bug or not, based on the historical data we already have from the community.
Before doing that, I recommend that you play around with the ./main analyze -h
subcommand as well to explore the latest set of data. You can also check out all
the continuously updated assets I provide within the analysis repository.
For example, those are the top 25 PR creators inside the Kubernetes repository:
Building the Machine Learning Model
Now we have an idea what the data set is about, and we can start building a first machine learning model. Before actually building the model, we have to pre-process all the extracted release notes from the PRs. Otherwise, the model would not be able to understand our input.
Doing some first Natural Language Processing (NLP)
In the beginning, we have to define a vocabulary for which we want to train. I
decided to choose the TfidfVectorizer from the Python scikit-learn machine
learning library. This vectorizer is able to take our input texts and create a
single huge vocabulary out of it. This is our so-called bag-of-words,
which has a chosen n-gram range of (1, 2) (unigrams and bigrams). Practically
this means that we always use the first word and the next one as a single
vocabulary entry (bigrams). We also use the single word as vocabulary entry
(unigram). The TfidfVectorizer is able to skip words that occur multiple times
(max_df), and requires a minimum amount (min_df) to add a word to the
vocabulary. I decided not to change those values in the first place, just
because I had the intuition that release notes are something unique to a
project.
Parameters like min_df, max_df and the n-gram range can be seen as some of
our hyperparameters. Those parameters have to be optimized in a dedicated step
after the machine learning model has been built. This step is called
hyperparameter tuning and basically means that we train multiple times with
different parameters and compare the accuracy of the model. Afterwards, we choose
the parameters with the best accuracy.
During the training, the vectorizer will produce a data/features.json which
contains the whole vocabulary. This gives us a good understanding of how such a
vocabulary may look like:
[
  …
  "hostname",
  "hostname address",
  "hostname and",
  "hostname as",
  "hostname being",
  "hostname bug",
  …
]
This produces round about 50,000 entries in the overall bag-of-words, which is pretty much. Previous analyses between different data sets showed that it is simply not necessary to take so many features into account. Some general data sets state that an overall vocabulary of 20,000 is enough and higher amounts do not influence the accuracy any more. To do so we can use the SelectKBest feature selector to strip down the vocabulary to only choose the top features. Anyway, I still decided to stick to the top 50,000 to not negatively influence the model accuracy. We have a relatively low amount of data (appr. 7,000 samples) and a low number of words per sample (~15) which already made me wonder if we have enough data at all.
The vectorizer is not only able to create our bag-of-words, but it is also able to encode the features in term frequency–inverse document frequency (tf-idf) format. That is where the vectorizer got its name, whereas the output of that encoding is something the machine learning model can directly consume. All the details of the vectorization process can be found in the source code.
Creating the Multi-Layer Perceptron (MLP) Model
I decided to choose a simple MLP based model which is built with the help of the popular TensorFlow framework. Because we do not have that much input data, we just use two hidden layers, so that the model basically looks like this:
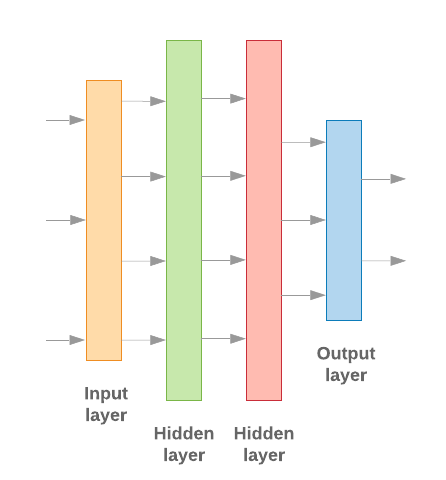
There have to be multiple other hyperparameters to be taken into account when creating the model. I will not discuss them in detail here, but they’re important to be optimized also in relation to the number of classes we want to have in the model (only two in our case).
Training the Model
Before starting the actual training, we have to split up our input data into training and validation data sets. I’ve chosen to use ~80% of the data for training and 20% for validation purposes. We have to shuffle our input data as well to ensure that the model is not affected by ordering issues. The technical details of the training process can be found in the GitHub sources. So now we’re ready to finally start the training:
> ./main train
INFO | Using already extracted data from data/data.pickle
INFO | Loading pickle dataset
INFO | Parsed 34380 issues and 55832 pull requests (90212 items)
INFO | Training for label 'kind/bug'
INFO | 6980 items selected
INFO | Using 5584 training and 1395 testing texts
INFO | Number of classes: 2
INFO | Vocabulary len: 51772
INFO | Wrote features to file data/features.json
INFO | Using units: 1
INFO | Using activation function: sigmoid
INFO | Created model with 2 layers and 64 units
INFO | Compiling model
INFO | Starting training
Train on 5584 samples, validate on 1395 samples
Epoch 1/1000
5584/5584 - 3s - loss: 0.6895 - acc: 0.6789 - val_loss: 0.6856 - val_acc: 0.6860
Epoch 2/1000
5584/5584 - 2s - loss: 0.6822 - acc: 0.6827 - val_loss: 0.6782 - val_acc: 0.6860
Epoch 3/1000
…
Epoch 68/1000
5584/5584 - 2s - loss: 0.2587 - acc: 0.9257 - val_loss: 0.4847 - val_acc: 0.7728
INFO | Confusion matrix:
[[920  32]
 [291 152]]
INFO | Confusion matrix normalized:
[[0.966 0.034]
 [0.657 0.343]]
INFO | Saving model to file data/model.h5
INFO | Validation accuracy: 0.7727598547935486, loss: 0.48470408514836355
The output of the Confusion Matrix shows us that we’re pretty good on
training accuracy, but the validation accuracy could be a bit higher. We now
could start a hyperparameter tuning to see if we can optimize the output of the
model even further. I will leave that experiment up to you with the hint to the
./main train --tune flag.
We saved the model (data/model.h5), the vectorizer (data/vectorizer.pickle)
and the feature selector (data/selector.pickle) to disk to be able to use them
later on for prediction purposes without having a need for additional training
steps.
A first Prediction
We are now able to test the model by loading it from disk and predicting some input text:
> ./main predict --test
INFO | Testing positive text:

        Fix concurrent map access panic
        Don't watch .mount cgroups to reduce number of inotify watches
        Fix NVML initialization race condition
        Fix brtfs disk metrics when using a subdirectory of a subvolume

INFO | Got prediction result: 0.9940581321716309
INFO | Matched expected positive prediction result
INFO | Testing negative text:

        action required
        1. Currently, if users were to explicitly specify CacheSize of 0 for
           KMS provider, they would end-up with a provider that caches up to
           1000 keys. This PR changes this behavior.
           Post this PR, when users supply 0 for CacheSize this will result in
           a validation error.
        2. CacheSize type was changed from int32 to *int32. This allows
           defaulting logic to differentiate between cases where users
           explicitly supplied 0 vs. not supplied any value.
        3. KMS Provider's endpoint (path to Unix socket) is now validated when
           the EncryptionConfiguration files is loaded. This used to be handled
           by the GRPCService.

INFO | Got prediction result: 0.1251964420080185
INFO | Matched expected negative prediction result
Both tests are real-world examples which already exist. We could also try something completely different, like this random tweet I found a couple of minutes ago:
./main predict "My dudes, if you can understand SYN-ACK, you can understand consent"
INFO  | Got prediction result: 0.1251964420080185
ERROR | Result is lower than selected threshold 0.6
Looks like it is not classified as bug for a release note, which seems to work. Selecting a good threshold is also not that easy, but sticking to something > 50% should be the bare minimum.
Automate Everything
The next step is to find some way of automation to continuously update the model with new data. If I change any source code within my repository, then I’d like to get feedback about the test results of the model without having a need to run the training on my own machine. I would like to utilize the GPUs in my Kubernetes cluster to train faster and automatically update the data set if a PR got merged.
With the help of Kubeflow pipelines we can fulfill most of these requirements. The pipeline I built looks like this:
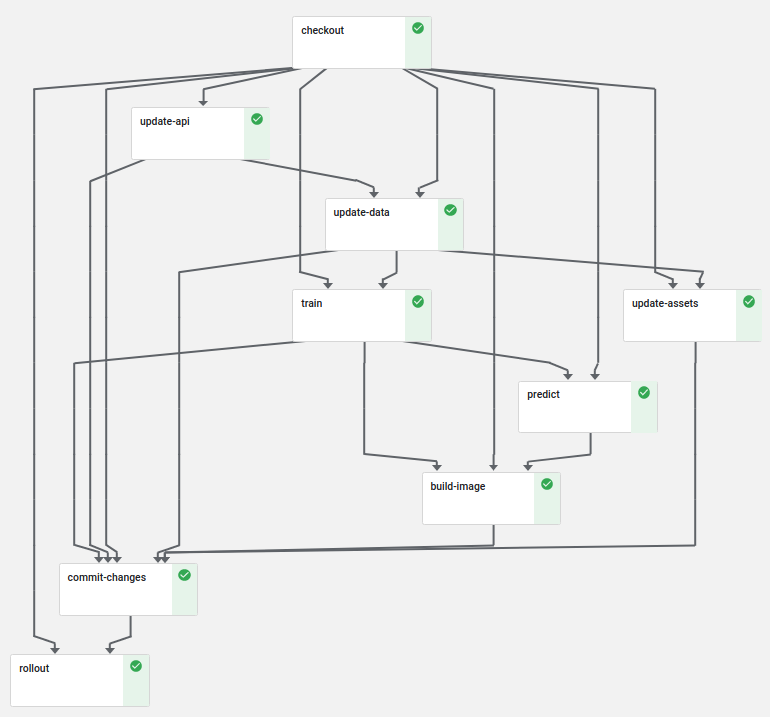
First, we check out the source code of the PR, which will be passed on as output artifact to all other steps. Then we incrementally update the API and internal data before we run the training on an always up-to-date data set. The prediction test verifies after the training that we did not badly influence the model with our changes.
We also built a container image within our pipeline. This container image
copies the previously built model, vectorizer, and selector into a container and
runs ./main serve. When doing this, we spin up a kfserving web server,
which can be used for prediction purposes. Do you want to try it out by yourself? Simply
do a JSON POST request like this and run the prediction against the endpoint:
> curl https://kfserving.k8s.saschagrunert.de/v1/models/kubernetes-analysis:predict \
    -d '{"text": "my test text"}'
{"result": 0.1251964420080185}
The custom kfserving implementation is pretty straightforward, whereas the deployment utilizes Knative Serving and an Istio ingress gateway under the hood to correctly route the traffic into the cluster and provide the right set of services.
The commit-changes and rollout step will only run if the pipeline runs on
the master branch. Those steps make sure that we always have the latest data
set available on the master branch as well as in the kfserving deployment. The
rollout step creates a new canary deployment, which only accepts 50% of the
incoming traffic in the first place. After the canary got deployed successfully,
it will be promoted as the new main instance of the service. This is a great way
to ensure that the deployment works as intended and allows additional testing
after rolling out the canary.
But how to trigger Kubeflow pipelines when creating a pull request? Kubeflow has no feature for that right now. That’s why I decided to use Prow, Kubernetes test-infrastructure project for CI/CD purposes.
First of all, a 24h periodic job ensures that we have at least daily up-to-date data available within the repository. Then, if we create a pull request, Prow will run the whole Kubeflow pipeline without committing or rolling out any changes. If we merge the pull request via Prow, another job runs on the master and updates the data as well as the deployment. That’s pretty neat, isn’t it?
Automatic Labeling of new PRs
The prediction API is nice for testing, but now we need a real-world use case. Prow supports external plugins which can be used to take action on any GitHub event. I wrote a plugin which uses the kfserving API to make predictions based on new pull requests. This means if we now create a new pull request in the kubernetes-analysis repository, we will see the following:
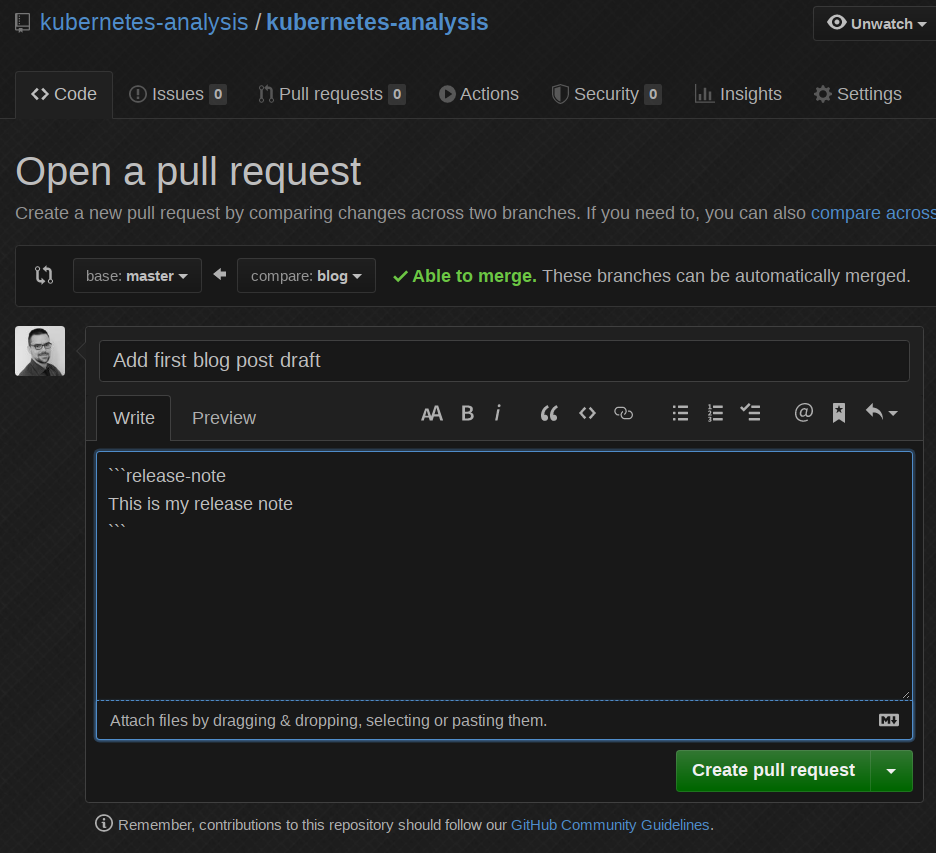
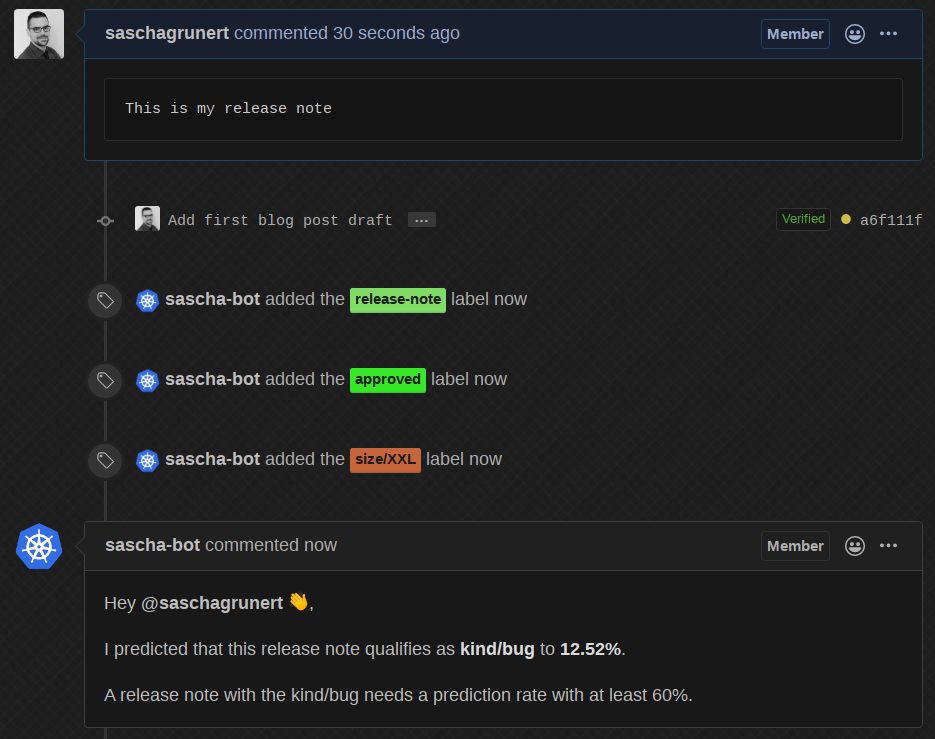
Okay cool, so now let’s change the release note based on a real bug from the already existing dataset:
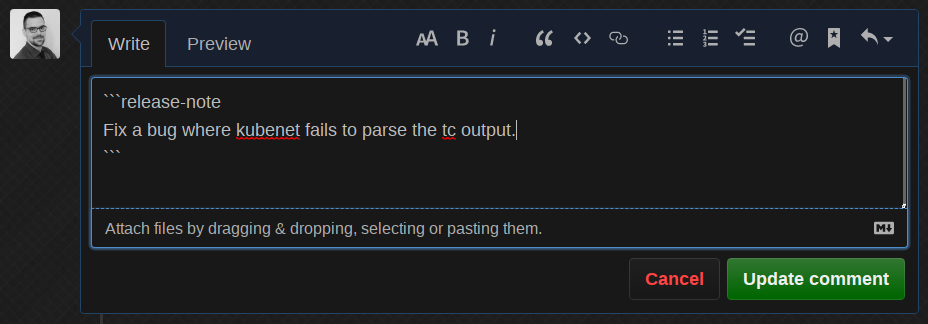
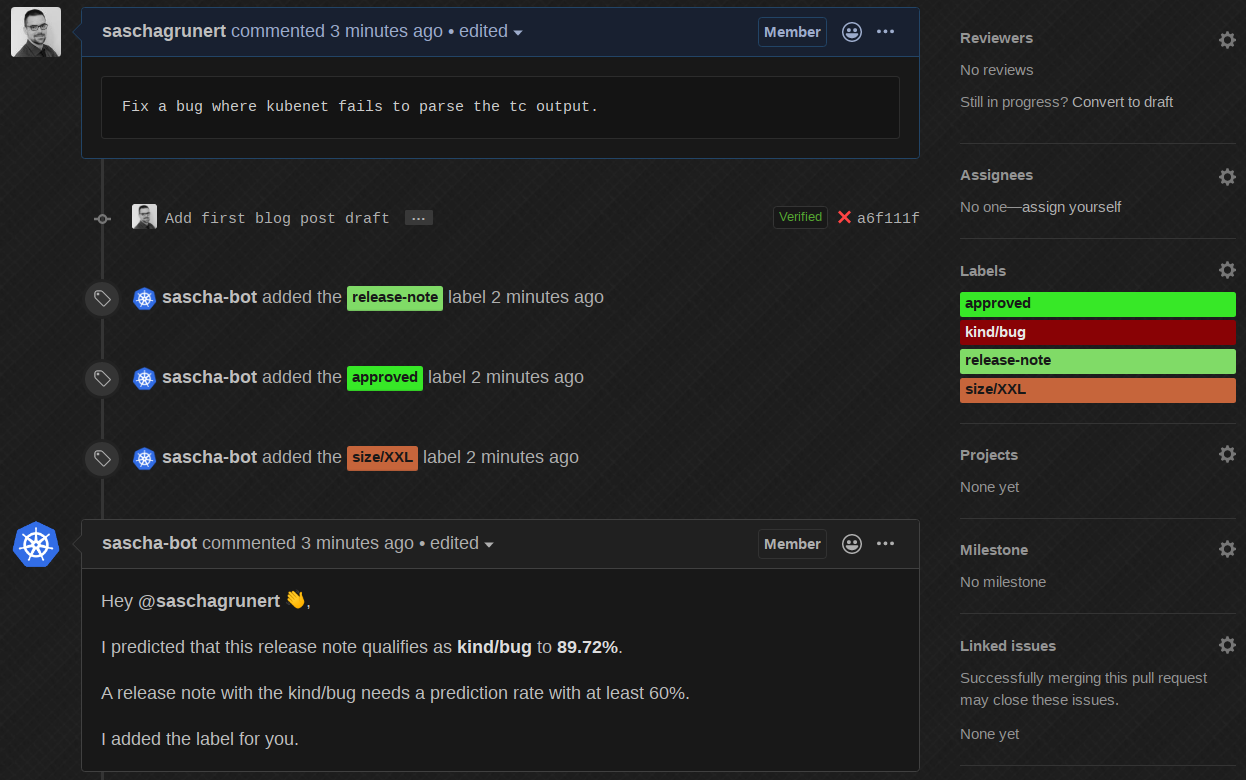
The bot edits its own comment, predicts it with round about 90% as kind/bug
and automatically adds the correct label! Now, if we change it back to some
different - obviously wrong - release note:
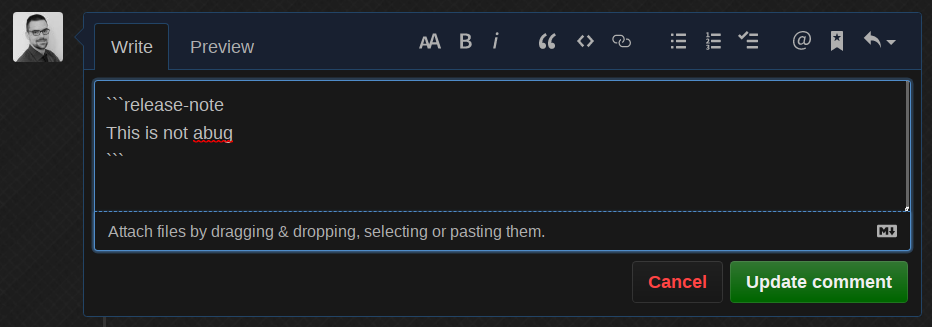
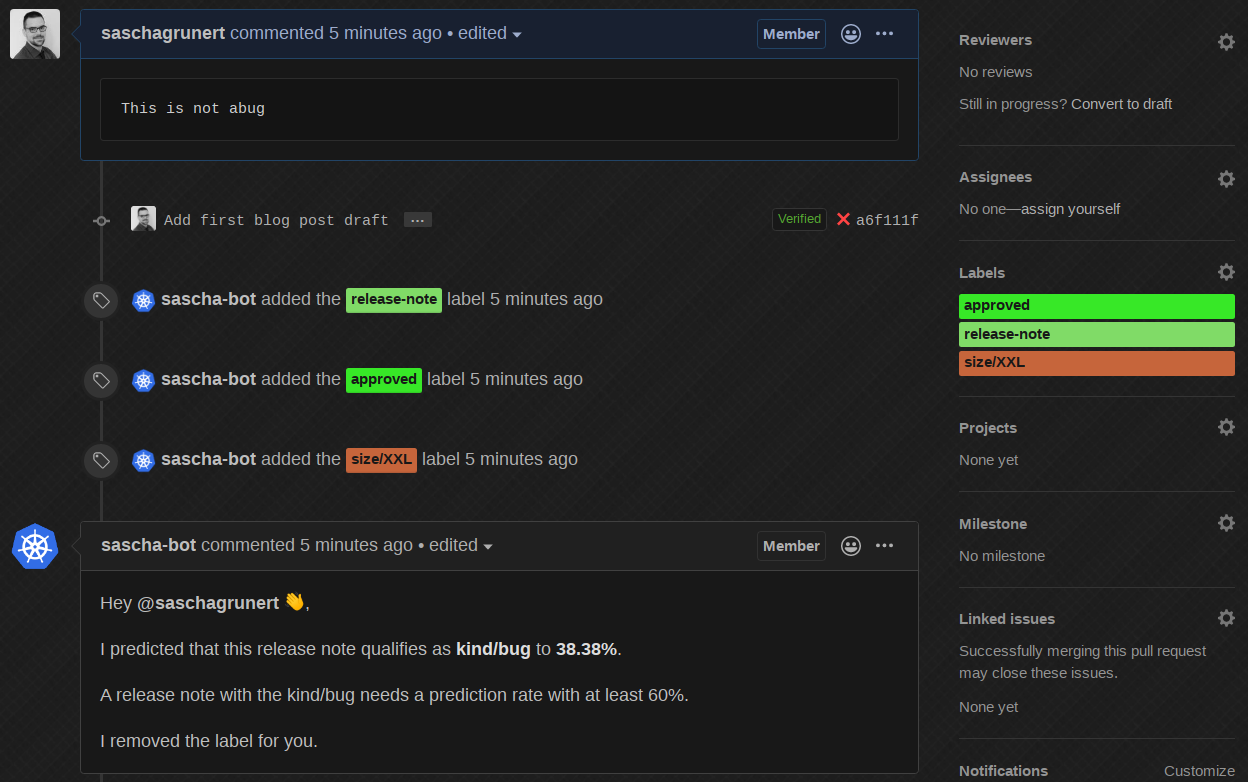
The bot does the work for us, removes the label and informs us what it did!
Finally, if we change the release note to None:
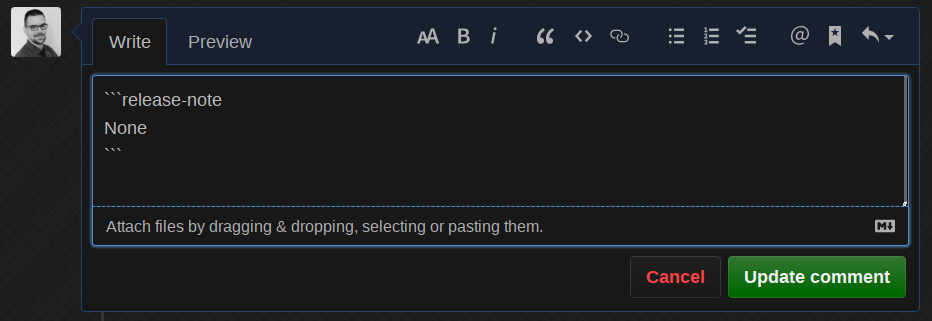
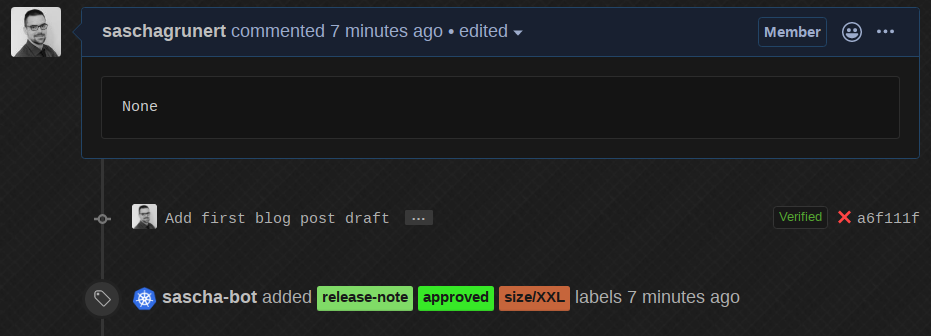
The bot removed the comment, which is nice and reduces the text noise on the PR. Everything I demonstrated is running inside a single Kubernetes cluster, which would make it unnecessary at all to expose the kfserving API to the public. This introduces an indirect API rate limiting because the only usage would be possible via the Prow bot user.
If you want to try it out for yourself, feel free to open a new test
issue in kubernetes-analysis. This works because I enabled the plugin
also for issues rather than only for pull requests.
So then, we have a running CI bot which is able to classify new release notes based on a machine learning model. If the bot would run in the official Kubernetes repository, then we could correct wrong label predictions manually. This way, the next training iteration would pick up the correction and result in a continuously improved model over time. All totally automated!
Summary
Thank you for reading down to here! This was my little data science journey
through the Kubernetes GitHub repository. There are a lot of other things to
optimize, for example introducing more classes (than just kind/bug or nothing)
or automatic hyperparameter tuning with Kubeflows Katib. If you have any
questions or suggestions, then feel free to get in touch with me anytime. See you
soon!


